23 Feb, 2008
How to make a progress/goal (thermometer-like) bar graph with PHP
Posted by: Jennifer In: PHP
On one of my projects recently, they needed a dynamic bar graph that would show the progress towards a goal of donations. I've never done something like that before, and it turns out it's actually pretty simple to do. I'll explain how the code works and then include everything at the end.
What we'll be doing is calling a php script into the src of an img tag in HTML. The php processes how to draw that image. We pass values to the PHP script to tell it what to draw. I'm going to show this with those values hardcoded in that src path – but in practice these values would probably be pulled from a database that totals up those numbers into a "total donation" value.
So first things first – since we'll be passing values in the src path – we need to check for them and then pull them into our script using $_GET: (also we'll say we're making a image with header)
if (isset($_GET['cur']) && isset($_GET['goal']) && isset($_GET['height']) && isset($_GET['width']) ) {

header("Content-type: image/png");

//setting the values we'll use in our script pulled in from GET

$height = trim($_GET['height']);

$width = trim($_GET['width']);

$goal = trim($_GET['goal']);

$current = trim($_GET['cur']);
Next – for the text to be displayed on the bar graph – we'll want to say what percent towards the goal we are. (Or if the goal is reached – just say 100%)
if ($current > $goal) {

//if we've reached the goal - just max out current value and say 100% achieved

//if you don't mind text saying over 100% then you can remove the next two lines

$current = $goal;

$percent= "100%!";

} else if ($current == "" || $current == "0") {

//if no donations - just say 0%

$percent = "0%";

} else {

//otherwise calculate the percent to goal text

$percent = round(($current/$goal)*100) . "%";

}
Now lets start building our bar graph. First we create an image and assign a variable name so we can apply stuff to it. Then, to create colors we can use on our image, we use the ImageColorAllocate function in PHP – so that it understands it's a color.
$im = @imagecreate($width,$height)

or die("Cannot Initialize new GD image stream");

$bg = imagecolorallocate($im,200,200,200); // grey

$fg = imagecolorallocate($im,255,0,0); //red

$text_color = imagecolorallocate($im, 0, 0, 0); //black
(Side note: The first color that is called with imagecolorallocate… this is the color which is used as the default background of the image even though it isn't SPECIFICALLY "applied" to the image as such in any particular function.)
Now we need to calculate the "fill" box. The box I'm creating in this example grows UP. This part for some reason I had the toughest time trying to understand what the values were and how to calculate it. What "x" and "y" were in relation to my graphic. So now that I have a basic understanding of how it works, I'll try to explain it in the way that I understand it.
We're going to use the imagefilledrectangle function to create the box in our graphic that shows how many donations we have. PHP.net shows the function like this:
imagefilledrectangle ($image, $x1, $y1, $x2, $y2, $color)
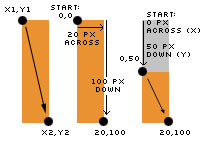
x1 and y1 are coordinates on our image. It starts at 0 at the top and then works across our width for our x value, and down our height for y value. x1,y1 are coordinates of the left point of our rectangle, and x2,y2 are the coordinates of the right point which is on the opposite/diagonal side of our rectangle. If we wanted to fill in our image completely and our image was 20pixels WIDE and 100pixels HIGH: the top left of the image x,y coordinate value is 0,0. Then we tell it the second x,y coordinate – again we go across the full width of the image for the x value (20pixels) and go down the height of the image to get the y value (100pixels). And if that didn't confuse you, I made a diagram that should make all that clear as mud:

In our thermometer/goal graph – that box is dynamic – so we need to calcuate that first x,y coordinate based on our donations. Specifically – the y coordinate – because that tells us how filled up our thermometer is. Here is how I calculate it. (Because you actually are still here even after my convoluted coordinate explanation I'll spare you the explanation of how the calculation works and you can take my word for it that it will figure out the correct height based on the goal and current achieved donation values.)
$fill = $height-(($current/$goal)*$height);
And now we make our rectangle:
imagefilledrectangle($im, 0, $fill, $width, $height, $fg);
Now lets write on our picture what the percentage is. imagstring has a few parameters that get passed – first is of course the image variable, then a "font" number (default fonts are 1-5), then another x , y coordinate. This will be the top left corner of where the text will show up. For simplicity sake I just have it a little off the corner at the top., then our text (we defined this earlier), and then our text color – (also defined earlier)
imagestring($im, 3, 2, 2, $percent, $text_color);
Then we output our image to the browser:
imagepng($im);
Clean up our mess and close our "if" statement:
imagedestroy($im);

}
Here's the whole thing in one file (rename it with a .php extension).
Call it in your html like this:
<img src="goalgraph.php?cur=1650&goal=3000&width=30&height=100" alt="Help us get to our goal" />
Bonus Tip
Now position your bar graph over another image with css.
(I removed the text in that last example because it was too thin…)
 scriptygoddess
